How to create a great dashboard

DOWNLOAD EBOOK
Good Business Intelligence is in many cases about communicating the knowledge gained from your data, to others.
But there can be many problems with sharing your knowledge. The truth that you dig out from your data sources can be complex and it can be difficult to visualize in a way that everyone understands. The key to it all is, of course, to have a good understanding of data visualization.

First of all:

A good data visualization is a clear data visualization. When you create your dashboard, avoid showing too much information. Focus on the part of your story that makes the most sense to the recipient. We recommend that you do show more things at a time, but remember - everything in moderation

Finally but most important:

When you create your dashboard, you should think in pictures, because the human brain is made to recognize patterns. In fact, research shows that the human brain treats visual information 600,000 times faster than text and that 90% of the information that the brain records is visual. In addition, 65% of all people learn best through visualizations. So when you create your dashboard, say to yourself: "How would it look like as a picture?"

Download our e-book 

Of course, there are a lot of different things to consider when creating a  good data visualization, but we can not write everything here. We do not have room for that.

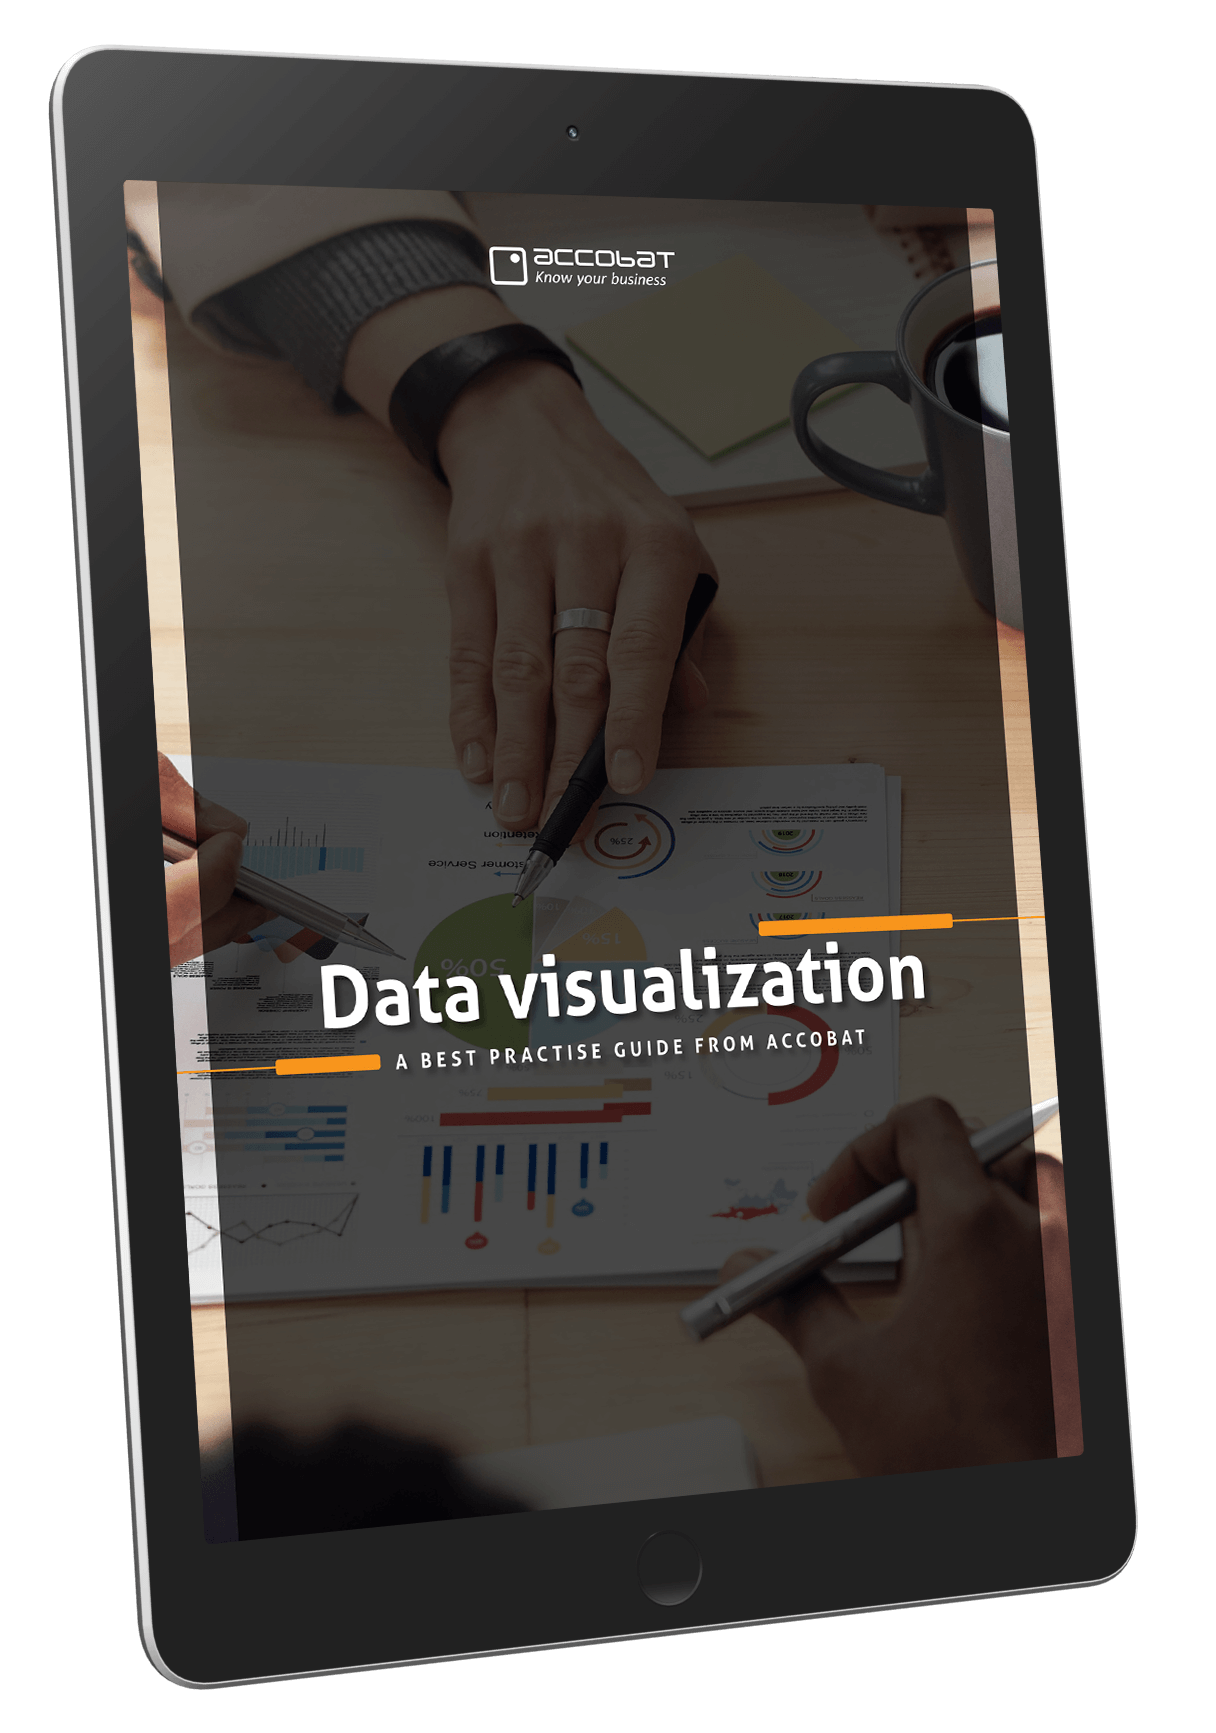
Therefore, we recommend that you download our free e-book on data visualizations and great dashboards.
We guarantee that you get something out of it.

Download
this eBook

This e-Book is about data visualization and better use of data

eBook_Datavisualisering_ENG

Once you have completed the form, you agree to receive further information from us. Do not worry - we will not spam you. Information from us is sent via MailChimp or Duda, both of which are GDPR compliant regarding data subsystems. Additional GDPR reservations are described when the form is completed and submitted. You will always be able to unsubscribe from Accobats information with a single click in emails from us.

Data visualization

Download free eBook

How to create a great dashboard

Good Business Intelligence is in many cases about communicating the knowledge gained from your data, to others.

But there can be many problems with sharing your knowledge. The truth that you dig out from your data sources can be complex and it can be difficult to visualize in a way that everyone understands. The key to it all is, of course, to have a good understanding of data visualization.


First of all:


A good data visualization is a clear data visualization. When you create your dashboard, avoid showing too much information. Focus on the part of your story that makes the most sense to the recipient. We recommend that you do show more things at a time, but remember - everything in moderation. 


Finally but most important:


When you create your dashboard, you should think in pictures, because the human brain is made to recognize patterns. In fact, research shows that the human brain treats visual information 600,000 times faster than text and that 90% of the information that the brain records is visual. In addition, 65% of all people learn best through visualizations. So when you create your dashboard, say to yourself: "How would it look like as a picture?"


Download our e-book 


Of course, there are a lot of different things to consider when creating a good data visualization, but we can not write everything here. We do not have room for that.


Therefore, we recommend that you download our free e-book on data visualizations and great dashboards.

We guarantee that you get something out of it.


Download eBook

- it's free

eBook_Datavisualisering

Once you have completed the form, you agree to receive further information from us. Information from us is sent via MailChimp or Duda, both of which are GDPR compliant regarding data subsystems. Additional GDPR reservations are described when the form is completed and submitted. You will always be able to unsubscribe from Accobats information with a single click in emails from us.
Datavisualisering guide
Share by: